
Estimated reading time: 9 minutes
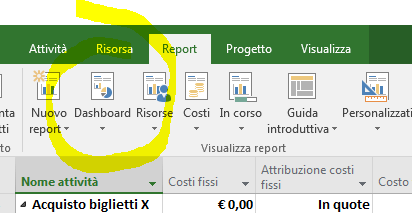
To create a project report, open the project and click the tab Report.
In the group View report, click on the icon that represents the type of report you want, and select the specific report.
For example, to open the report General project information, we enter the menu Report, in the group View Report click on the icon Dashboard then click on the option General project information
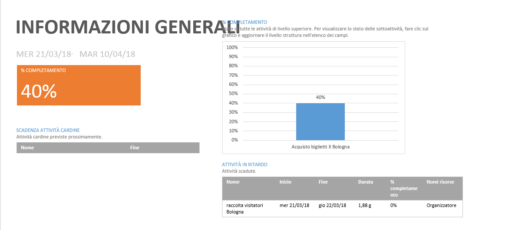
The report General project information combines graphs and tables to show where each phase of the project is, upcoming milestones and deadlines.
MS Project provides dozens of ready-to-use reports. In addition to these pre-packaged reports, you can also make customized reports. You can customize the content and appearance of one of the existing reports, or create a new one from scratch.
You can choose the data that the Project shows in any part of a report.
Click on the table or chart you want to edit.
Use the panel on the right of the object to select fields, to show and filter information.
When you click on a chart, three buttons appear to the right of the chart. With the "+" you can choose graphic elements, with the brush you can change the style, and with the funnel you can apply filters to quickly select elements such as data labels and filter the information entered in the graph.
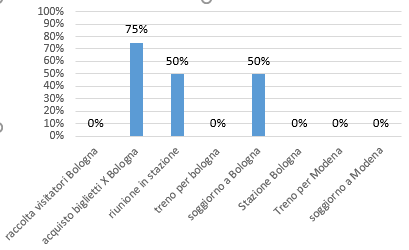
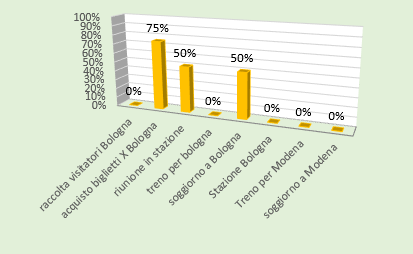
In the report General informations, you can change the complete chart to view critical secondary activities instead of top-level summary tasks:
Click anywhere in the% Completion table.
In the Field List pane, go to the Filter box and select Critical.
In the Structure Level box, select 2 Level. For this example, this is the first level of the structure that contains secondary activities rather than summary tasks.
The graph changes when you make selections.
With Project, you control the appearance of your reports, from black and white, to color explosions and effects.
You can create a part of a report of a split view so you can see the report change in real time as you work on the project data.
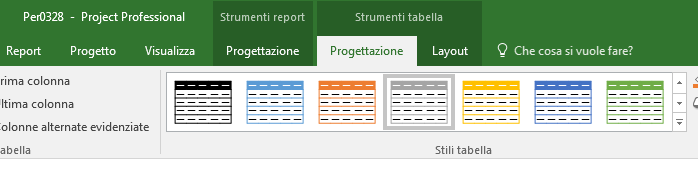
Click anywhere in the report and then click Table tools to view options to change the appearance of the entire report. From this tab you can change the font, color or theme of the entire report. You can also add new images (including photos), shapes, graphics or tables.
When you click on individual items (graphs, tables, and so on) of a report, new tabs are displayed at the top of the screen with options for formatting that part.
When you click on a chart, three buttons are also displayed directly to the right of the chart. By clicking on the button Graphic styles you can quickly change the colors or style of the chart.
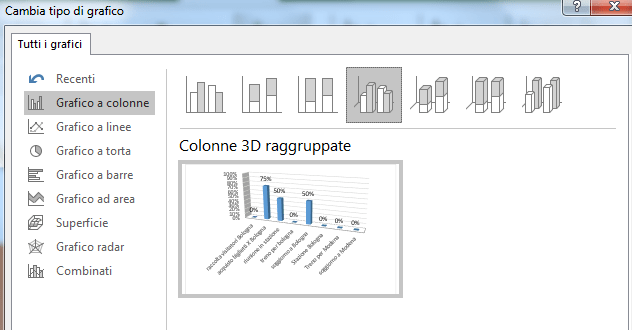
Suppose we want to improve the appearance of the graph General informations which we find in the Dashboard drop-down menu in the Report menu.
Select the Column chart > and in particular one of the possibilities in 3D.
Give your report a name and start adding information
All the graphics you create from scratch are completely customizable. You can add and delete items and change the data according to your needs.
Paste the report in any program that displays graphics.
Ercole Palmeri
An ophthalmoplasty operation using the Apple Vision Pro commercial viewer was performed at the Catania Polyclinic…
Developing fine motor skills through coloring prepares children for more complex skills like writing. To color…
The naval sector is a true global economic power, which has navigated towards a 150 billion market...
Last Monday, the Financial Times announced a deal with OpenAI. FT licenses its world-class journalism…


