Estimated reading time: 8 minutes
When there is a difference between what is planned and the actual performance of the project, we have a Variation. The variation is measured mainly in terms of time and in terms of cost.
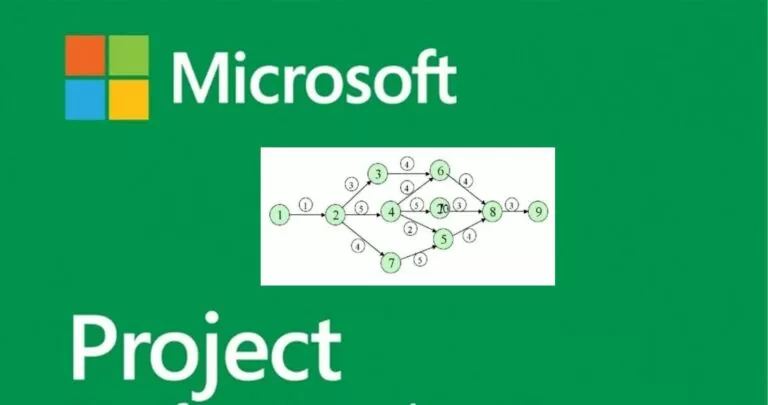
There are different ways to view the activity with the variation, i.e. find evidence of the difference between the estimate and the final balance.
Below we see 4 methods:
Click on the tab Immagine in the menu bar, in the group Activity views select Gantt verification in the drop-down list Gantt chart.
You can compare the Gantt bars "currently scheduled" with the "initially planned" Gantt bars. You can see which tasks were started later than planned, or required more work to complete.
Click on the tab Immagine in the menu bar, in the group Activity views select Gantt detail in the drop-down list Gantt chart
Click on the tab Immagine in the menu bar, in the group Data select change in the drop-down list Table
Click on the tab Immagine in the menu bar, in the group Data select Other Filters in the drop-down list filters, and choose a filter like Late activities, Slipping activity,… etc…
Microsoft Project will filter the task list to show only the activities filtered in this process. So if you select Late activities, only incomplete activities will be displayed. Any activity already completed will not be displayed.
To examine the costs in a project life cycle, you should be aware of these terms and what they mean in Microsoft Project
Click on the tab Immagine in the menu bar, in the group Data select Cost in the drop-down list Table
You will be able to view all relevant information. You can also use filters to view activities that exceed your budget.
Click on the tab Immagine in the menu bar, in the group Data select Other filters in the drop-down list Filters. Finally select Cost out of budget and confirm with the button Apply
For some organizations, resource costs are primary costs and sometimes the only cost, so these must be closely monitored.
Click on the tab Immagine in the menu bar, in the group View Resources select Resource List
For costs, click on the tab Immagine in the menu bar, in the group Data select Cost in the drop-down list Table
We can sort the Costs column to see which are the most expensive and least expensive resources.
To sort, you need to click on the auto filter arrow in the Cost column header. When the drop-down menu appears, click Order from largest to smallest.
You can use the AutoFilter function for each column, by ordering the Variance column, you will be able to see the variance model.
Automatic filter
Microsoft Project comes with a pre set of reports and dashboardsdefiniti. You will find them all in the tab Report. You can also create and customize graphical reports for your project.
Click on Report → View group Report → Dashboard.
Click on Report → View group Report → Resources.
Click on Report → View group Report → Costs.
click on Report → View group Report → In progress.
Click on Report → View group Report → New report.
There are four options.
Microsoft Project aims to help users develop realistic project goals through planning well-considered, budget management and resource distribution.
Users can create projects, track tasks, and report results.
Additionally, it gives project managers and project owners significant control over their resources and finances.
This is achieved through simple processes to assign resources to tasks and budgets to projects.
MS Project Online and Project Desktop differ significantly.
MS Project Online caters to multiple users who can assign tasks, track time, and review other related project items.
The desktop version is primarily aimed at project managers who use it for definish and track activities.
When you start a new planning, you add tasks and organize them efficiently so that the project finish date happens as soon as possible.
To start entering your first schedule and get your first Gantt chart, follow the steps described in this article.
Ercole Palmeri
Developing fine motor skills through coloring prepares children for more complex skills like writing. To color…
The naval sector is a true global economic power, which has navigated towards a 150 billion market...
Last Monday, the Financial Times announced a deal with OpenAI. FT licenses its world-class journalism…
Millions of people pay for streaming services, paying monthly subscription fees. It is common opinion that you…